Edit chart
Loading graph
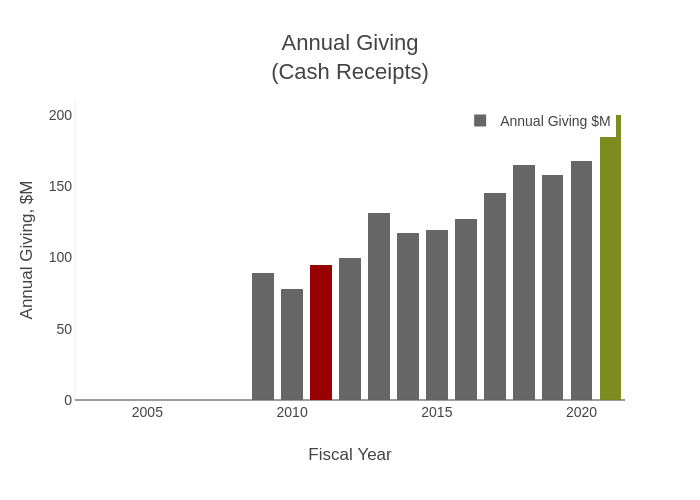
Provostncstate's interactive graph and data of "Annual Giving(Cash Receipts)" is a stacked bar chart, showing Annual Giving $M, Baseline Annual Giving, Goal Annual Giving; with Fiscal Year in the x-axis and Annual Giving, $M in the y-axis.. The x-axis shows values from 2002.5 to 2021.5. The y-axis shows values from 0 to 210.5263157894737.